Since 7.3.0
Bundle Graph
The Bundle Graph view gives you an interactive, visual picture of how OSGi bundles depend on each other. Instead of reading lists of requirements and capabilities, you can see the relationships between bundles at a glance and quickly understand the impact of adding or removing a bundle from your runtime.
Opening the View
Open the view via Window › Show View › Other… and search for Graph. Once open, you can populate it by dragging any of the following onto the Available bundles list:
- A project from the Bndtools Explorer / Package Explorer
- A repository (or individual bundles) from the Repositories View
- A
.bndrunfile from the workspace
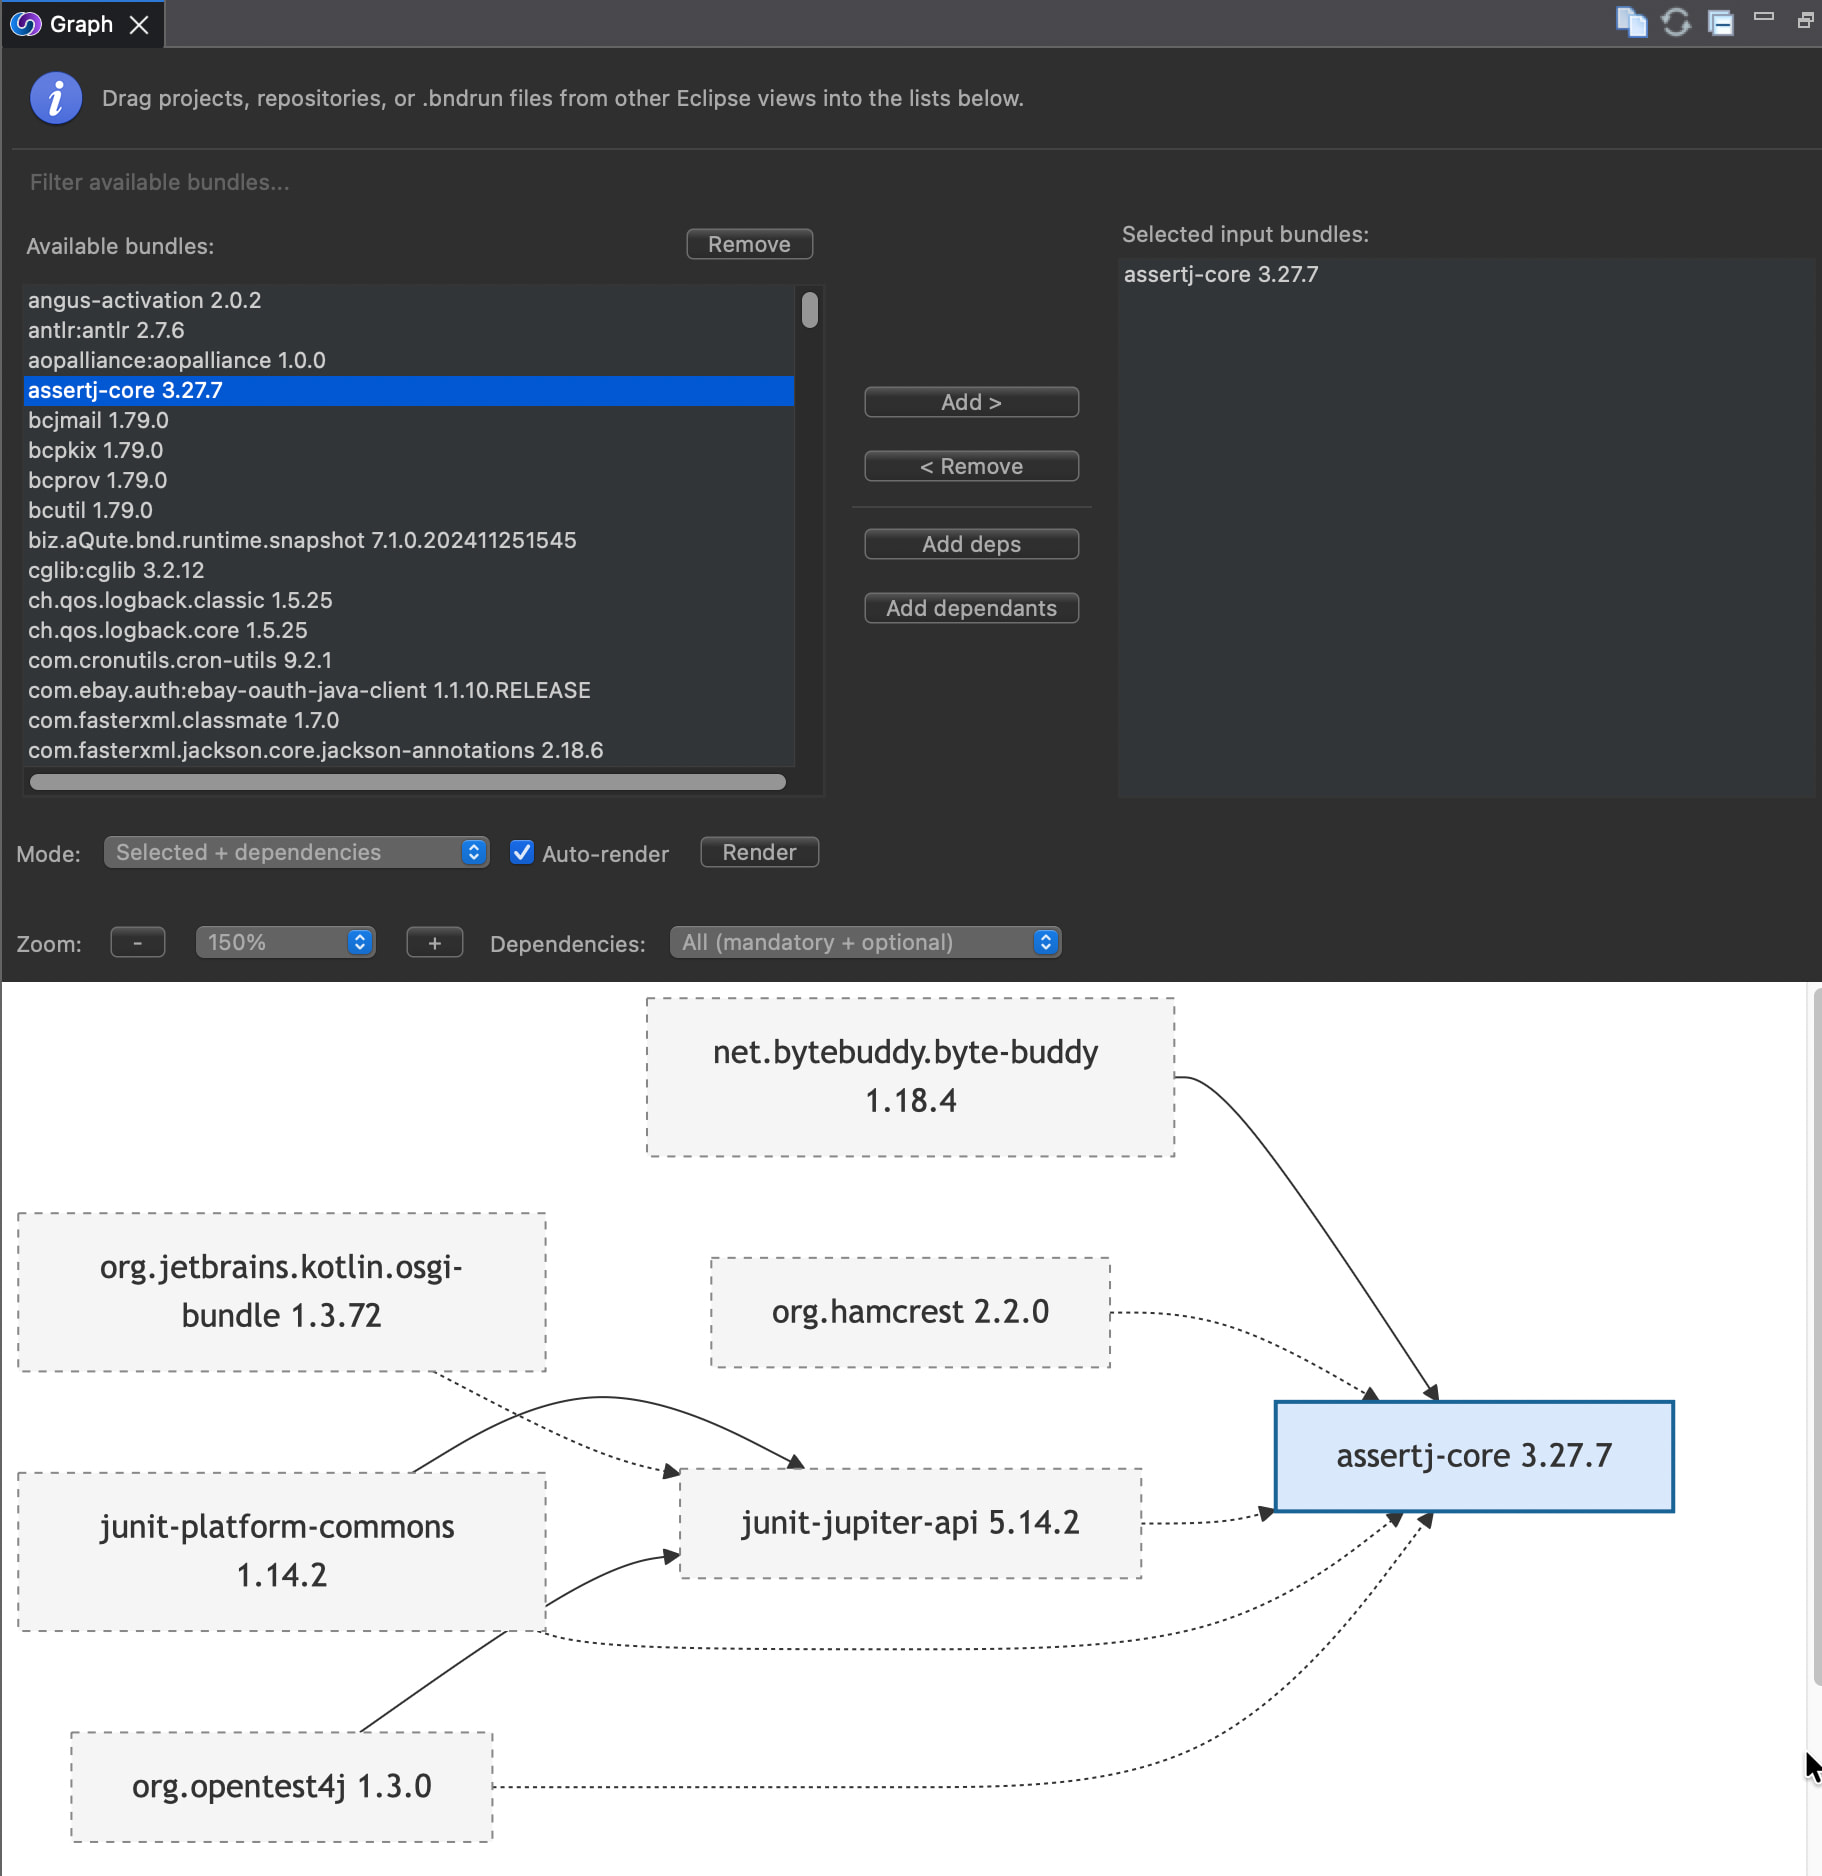
Interface Overview
The view is split into three areas:
| Area | Purpose |
|---|---|
| Available bundles (left panel) | Lists every bundle that was dragged into the view. Use the Filter field at the top to narrow down the list by name. |
| Selected input bundles (right panel) | The bundles you specifically want to centre the graph on. Move bundles here with the Add > button or by double-clicking. |
| Graph canvas (bottom) | An interactive diagram showing the bundles and their dependency edges. |
Toolbar Buttons
The toolbar at the top right of the view provides quick access to common actions:
- New Graph – clears the view and starts a fresh graph.
- Refresh – re-renders the graph using the current settings.
- Layout – switches between available automatic layout algorithms.
- Minimise / Maximise – standard Eclipse view controls.
Controls
Mode
The Mode drop-down (bottom-left of the view) controls which bundles are included in the graph:
| Mode | Description |
|---|---|
| Selected + dependencies | Shows the selected input bundles together with all bundles they (transitively) depend on. |
| Selected + dependants | Shows the selected input bundles together with all bundles that (transitively) depend on them. |
| Selected + both | Combines both directions – ideal for understanding the full neighbourhood of a bundle. |
Auto-render
When Auto-render is checked, the graph is automatically redrawn whenever the selection or settings change. Uncheck it if you want to batch-configure the view before rendering (useful for large graphs), then click Render to draw the result.
Zoom
Use the – and + buttons to zoom the canvas in and out, or choose a fixed percentage from the drop-down between them. The zoom level is shown as a percentage (e.g. 100%).
Dependencies Filter
The Dependencies drop-down lets you choose which kinds of dependency edges to display:
| Option | Description |
|---|---|
| All (mandatory + optional) | Draws both solid (mandatory) and dashed (optional) edges. |
| Mandatory only | Hides optional dependency edges to reduce visual noise. |
| Optional only | Shows only optional dependency edges. |
Graph Interactions
- Pan – click and drag on the canvas background to pan around.
- Select – click on a node to highlight it and its direct neighbours.
- Add / Remove – use the Add >, < Remove, Add deps, and Add dependants buttons to refine which bundles are in the Selected input bundles panel without leaving the view.
- Remove from available – select one or more bundles in the Available bundles list and click Remove to remove them from the pool entirely.
Reading the Graph
- Each node (rectangle) represents one bundle. Its label shows the Bundle Symbolic Name and version.
- Solid arrows indicate a mandatory dependency (the source bundle requires a package or capability that the target bundle provides and that dependency is not optional).
- Dashed arrows indicate an optional dependency.
- The selected input bundle(s) are highlighted with a distinct border so they are easy to spot even in large graphs.
Use Cases
Understanding the transitive footprint of a bundle
Select a bundle in Available bundles and click Add > to move it to Selected input bundles. With mode set to Selected + dependencies, the graph shows you every bundle that will be pulled in at runtime — helping you judge whether a dependency is too heavy before you commit to it.
Finding out which bundles depend on a given bundle
Move the bundle of interest to Selected input bundles and switch mode to Selected + dependants. The graph shows every bundle that (transitively) relies on the chosen bundle, which is invaluable when you plan to update or replace it.
Investigating a failed resolution
After a failed Resolve in the bnd / bndrun editor, drag the .bndrun file into the view. The graph lets you trace dependency chains visually and spot which bundle is the root cause of the missing requirement.
Comparing dependency chains across two bundles
Drag both bundles into the view, add them both to Selected input bundles, and choose Selected + both. The graph highlights shared sub-graphs and makes diverging dependency paths immediately apparent.
Reducing optional dependencies
Set the Dependencies filter to Optional only to see which optional wiring is active in your runtime. You can then decide which optional bundles are worth including and which can be left out to keep the runtime lean.
More Information
- Resolving Dependencies – background on OSGi requirements and capabilities.
- Resolution View – a complementary view that shows requirements and capabilities in list form.
- Repositories View – browse and manage the repositories that supply bundles to the graph.
Prev Next
